Trend analysis is simple enough to explain in a few sentences.
Doing it consistently on a live chart is harder.
Most mistakes do not come from not knowing what a higher high or lower low means. They come from interpreting price too quickly, changing the rules after the fact, or trying to turn uncertain information into certainty.
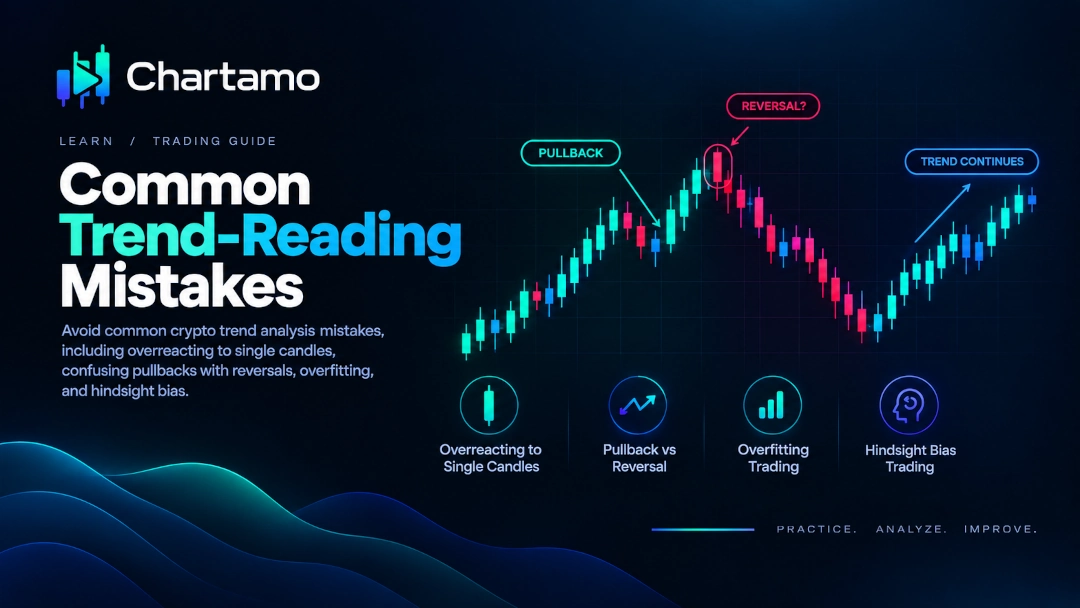
1. Looking at Only One or Two Candles
A large candle can attract your attention immediately.
But a market trend is a sequence, not a single candle.
A large green candle inside a downtrend does not automatically create an uptrend. A large red candle inside an uptrend does not automatically create a downtrend.
Zoom out and look at the structure.
2. Confusing a Pullback With a Reversal
Markets rarely move in a straight line.
Uptrends pull back. Downtrends rally.
If you treat every move against the current trend as a reversal, you will constantly change your market bias.
Instead, ask whether an important structural level has actually been broken.
3. Treating Every Small Swing as Market Structure
Charts contain noise.
If you label every tiny high and low, almost any market can be made to look like an elaborate pattern.
Focus on meaningful swing points that represent actual movements in price.
4. Overfitting
Overfitting happens when you create rules that explain a particular historical chart extremely well but fail to generalize to new data.
For example, you might find a very specific combination of candle shapes and indicator values that would have identified one historical trend perfectly.
That does not mean the same rules will work tomorrow.
A good framework should remain understandable and useful across many different market conditions.
5. Changing Your Analysis After Seeing the Future
This is particularly dangerous when practicing with historical charts.
You look at the complete move and think:
"The reversal was obvious."
It was obvious because you already know what happened.
Real-time analysis does not give you that information.
When practicing, reveal price progressively whenever possible. Make your decision based only on what was available at that point.
6. Forcing Every Market Into a Trend
Sometimes there is no clean trend.
Price may simply be ranging between support and resistance.
Recognizing uncertainty is not a failure of analysis. It is part of analysis.
7. Using Too Many Indicators
Indicators can be useful, but adding more of them does not necessarily make your conclusion stronger.
If several indicators are derived from the same price data, they may simply be presenting similar information in different forms.
Start with price structure and add tools only when they answer a specific question.
8. Treating Trend Analysis as Prediction
A trend describes what price has been doing. It does not guarantee what price will do next.
This distinction is easy to forget.
You can correctly identify an uptrend and still see price fall on the next candle.
Being right about the current structure is not the same thing as predicting the future.
A Better Process
When reading a chart, slow the process down:
- Identify the timeframe.
- Mark meaningful swing highs and lows.
- Determine whether the structure is bullish, bearish, or ranging.
- Look for important structural breaks.
- Consider additional context such as volume or momentum.
- State what you know without pretending to know what happens next.
This approach may feel less exciting than predicting the next big move.
It is also much easier to test.
Practice Without Hindsight
The fastest way to improve trend reading is to practice on historical data while hiding the future.
That turns trend analysis from something you simply read about into a skill you can repeatedly test.
Practice Trend Identification on Chartamo