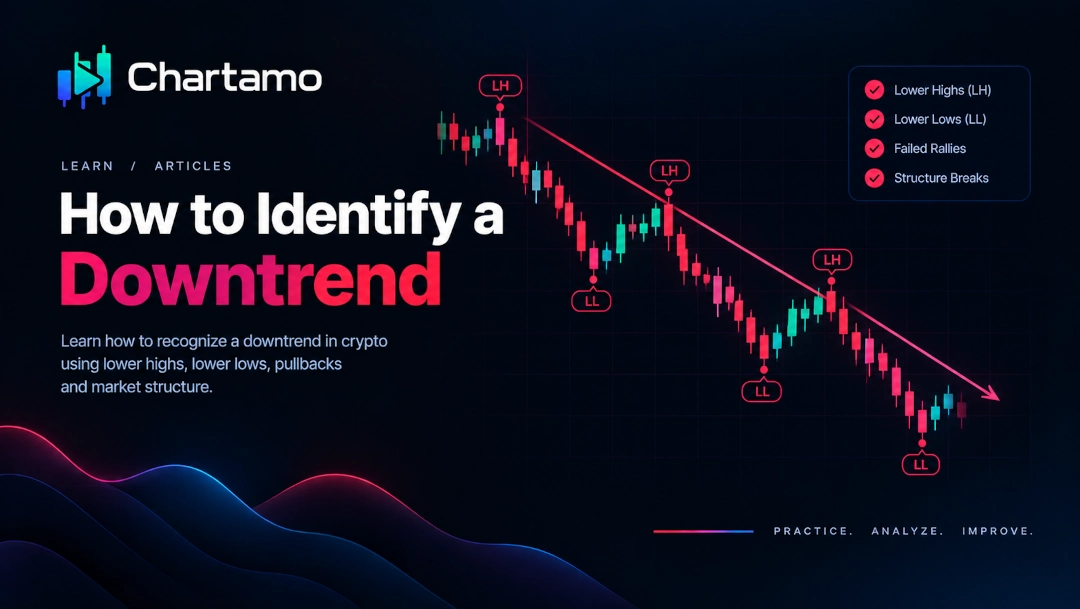
A downtrend is not simply a chart filled with red candles.
Markets can fall sharply during a correction and still remain inside a larger bullish structure. To identify a genuine downtrend, look at how price builds its market structure.
The Basic Structure of a Downtrend
A typical downtrend creates:
- Lower Low (LL)
- Lower High (LH)
In simple terms, sellers are able to push price below a previous important low, while subsequent rallies fail to recover the previous important high.
Lower Lows
A lower low forms when price moves below a previous meaningful swing low.
This tells us that sellers have managed to extend the decline.
One lower low alone does not prove that a long-term downtrend exists. The surrounding structure matters.
Lower Highs
After price falls, it often rallies.
In a downtrend, that rally tends to fail below the previous important swing high.
This creates a lower high.
That failed recovery is important because it shows that buyers have not yet regained control of the previous range.
Pullbacks in a Downtrend
A rally during a downtrend does not automatically mean the market has reversed.
For example, imagine BTC falls from $70,000 to $65,000 and then rallies to $67,000.
The rally may simply be a pullback.
If price then fails around $67,000 and falls below $65,000, the bearish structure becomes clearer: a lower high followed by a lower low.
Break of Bearish Structure
One of the first warnings that a downtrend may be weakening is a meaningful break above an important lower high.
But be careful with the wording.
A break above one swing high does not guarantee a new uptrend.
Price may instead enter a range or produce a false breakout before continuing lower.
This is why trend analysis works better when you observe what happens after the break.
Common Mistakes
Assuming Every Bounce Is a Reversal
Strong rallies can happen inside powerful downtrends.
Ignoring Swing Highs
Lower highs are just as important as lower lows. They show where previous buying attempts failed.
Using One Candle as Evidence
A large bullish candle can be significant, but it does not erase the entire bearish structure by itself.
Forcing a Trend
Sometimes price is simply ranging. Not every chart needs to be classified as bullish or bearish.
What Should You Look For?
When examining a possible downtrend, ask:
- Where are the meaningful swing highs?
- Where are the meaningful swing lows?
- Are new lows being created?
- Are rallies failing below previous highs?
- Has an important lower high been broken?
These questions are much more useful than asking whether the latest candle is red.
Related Guides
How to Identify a Sideways Market
Then put the idea to the test with historical market data.