Once you can identify market structure, the next question is obvious:
How confident should you be that the trend is actually meaningful?
There is no single indicator that can answer that question.
A better approach is to combine price structure with context from other parts of the market.
Start With Price Structure
The foundation should remain simple.
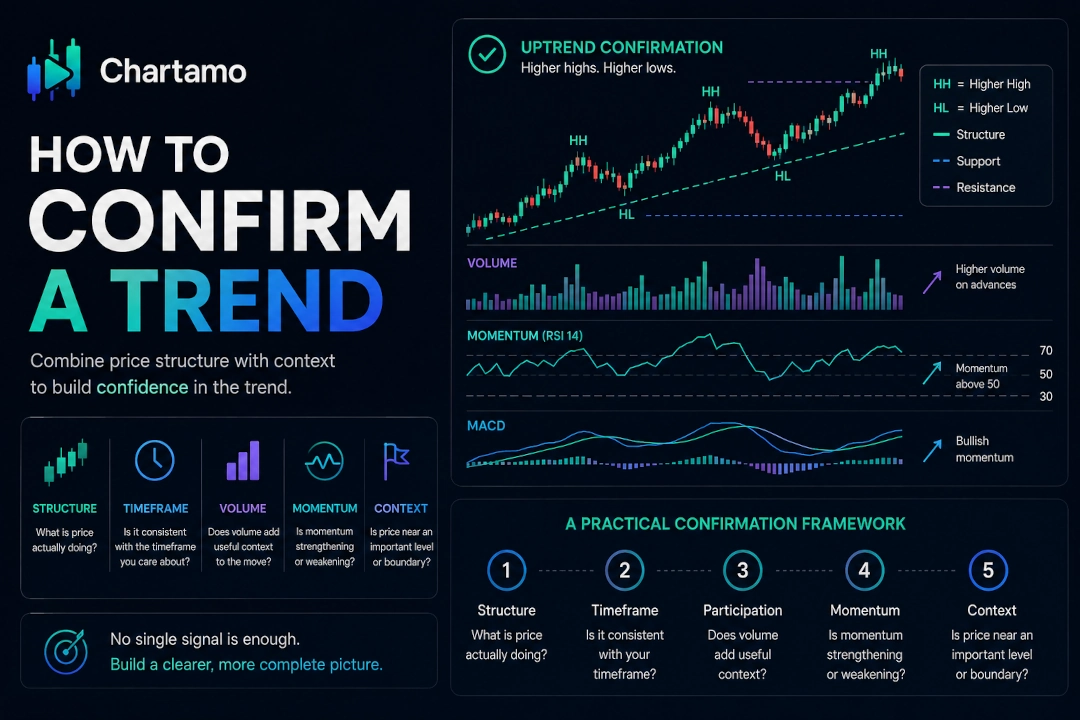
In an uptrend, look for higher highs and higher lows.
In a downtrend, look for lower highs and lower lows.
Indicators should add context to this information rather than replace it.
Use Multiple Timeframes
A trend exists relative to a timeframe.
For example, price may be trending upward on a 15-minute chart while the daily chart remains bearish.
This does not mean one timeframe is wrong.
It means you are looking at different layers of market structure.
A useful approach is to identify the broader context on a higher timeframe and then examine the shorter timeframe for more detailed price movement.
Volume
Volume can provide additional context about participation behind price movements.
A price move accompanied by noticeably higher volume may indicate stronger participation than a similar move occurring on very low volume.
But volume should not be treated as a simple rule such as:
"High volume means the trend will continue."
High volume can occur during reversals, breakouts, liquidations, and other events.
Use it as evidence, not as a prediction machine.
Momentum
Momentum indicators can help describe the strength and speed of price movement.
They can sometimes reveal that momentum is weakening even while the broader trend remains intact.
That can be useful information.
But weakening momentum is not the same as a confirmed reversal.
Why One Signal Is Not Enough
Imagine price is in an uptrend, but an oscillator shows bearish divergence.
That may be worth watching.
But if price continues creating higher highs and higher lows, the bullish structure has not automatically disappeared.
Likewise, a single volume spike does not prove that a breakout will succeed.
Each piece of information answers a different question.
A Practical Confirmation Framework
You can keep the process simple:
- Structure: What is price actually doing?
- Timeframe: Is the structure consistent with the timeframe you care about?
- Participation: Does volume add useful context?
- Momentum: Is price movement strengthening or weakening?
- Context: Is the market near an important support, resistance, or range boundary?
You do not need every answer to point in the same direction.
The goal is to build a more complete picture.
Keep the Chart Readable
Adding more indicators does not automatically produce better analysis.
In fact, too many indicators can make a simple market structure harder to see.
If five indicators are required before you can explain why a market is trending, it may be worth simplifying the chart.
Related Guides
How to Identify a Sideways Market
Then practice applying the same framework to historical price action.